F at a glance.
F is the result of running an image through four independent analyses, fractal complexity, rhythm, colour, and structure, and combining them into one weighted score. The sweet spot is 0.55–0.75, where buildings tend to feel sammenhængende and fluent without tipping into either monotony or chaos.
No single dimension can dominate F. A tile roof scores high on raw fractal dimension but low on lacunarity and edge diversity, so its F stays modest. That asymmetry is intentional.
Four dimensions.
Each dimension is itself an inverted-U function peaking at its own empirical sweet spot, then weighted into F. Click through to the science page for the full mathematical treatment.
Fractal complexity
30%Rich detail across scales.
Built on the classic fractal dimension D (Mandelbrot, Ostwald & Vaughan), modulated by lacunarity Λ and edge-orientation entropy Hθ. The modulation is what catches uniformly repetitive textures and stops them gaming the score.
D · Λ · Hθ · κ
Rhythm & composition
25%Repeating patterns the eye can predict.
From 2D autocorrelation (peak strength R), spectral slope β centred on Spehar's 1/f1.2 aesthetic preference, and fenestration regularity Rw when window placement can be detected.
R · β · Rw
Colour
20%Palette that reads as harmonious.
Built on Fractune's existing Chromatic Fluency C, chromatic entropy, palette coherence, and ecological deviation in CIELAB, plus a value-contrast term Δ_L that captures luminance composition (lys/skygge-spil) which pure hue analysis misses.
C · Δ_L
Structure
25%The compositional bones.
Visual balance B, hierarchical scaling Σ_h (Salingaros' demand for detail across multiple scales related by 2–4×), solid/void ratio V (window-to-wall proportion), and curvature ratio κ. Stamps' β = 0.72 for surface complexity makes B and Σ_h the heaviest terms.
B · Σ_h · V · κ
Why composite, not just D?
For two decades, the standard quantitative measure of architectural complexity has been fractal dimension D, Mandelbrot's box-counting exponent. Spehar & Taylor's research showed people consistently prefer fractal patterns near D = 1.3–1.5; Ostwald & Vaughan's monograph measured D = 1.41 across 85 canonical buildings.
But D alone treats a tile roof and a Gothic cathedral as equivalent if their box-counting curves happen to coincide. Empirically, a uniformly-shingled flat surface and a multi-scale ornamented facade can hit the same D value. F was designed specifically to discriminate these cases.
The discrimination comes from two independent modifiers on the fractal dimension: lacunarity (Allain & Cloitre, 1991) measures how clumpy versus jævn the detail is, and edge-orientation entropy (Stanischewski et al., 2020, perhaps the single strongest predictor of facade preference identified in the literature) measures how many directions edges run in. A tile roof has low lacunarity and low edge-orientation entropy. F_fractal penalises this combination accordingly.
Reading an F value.
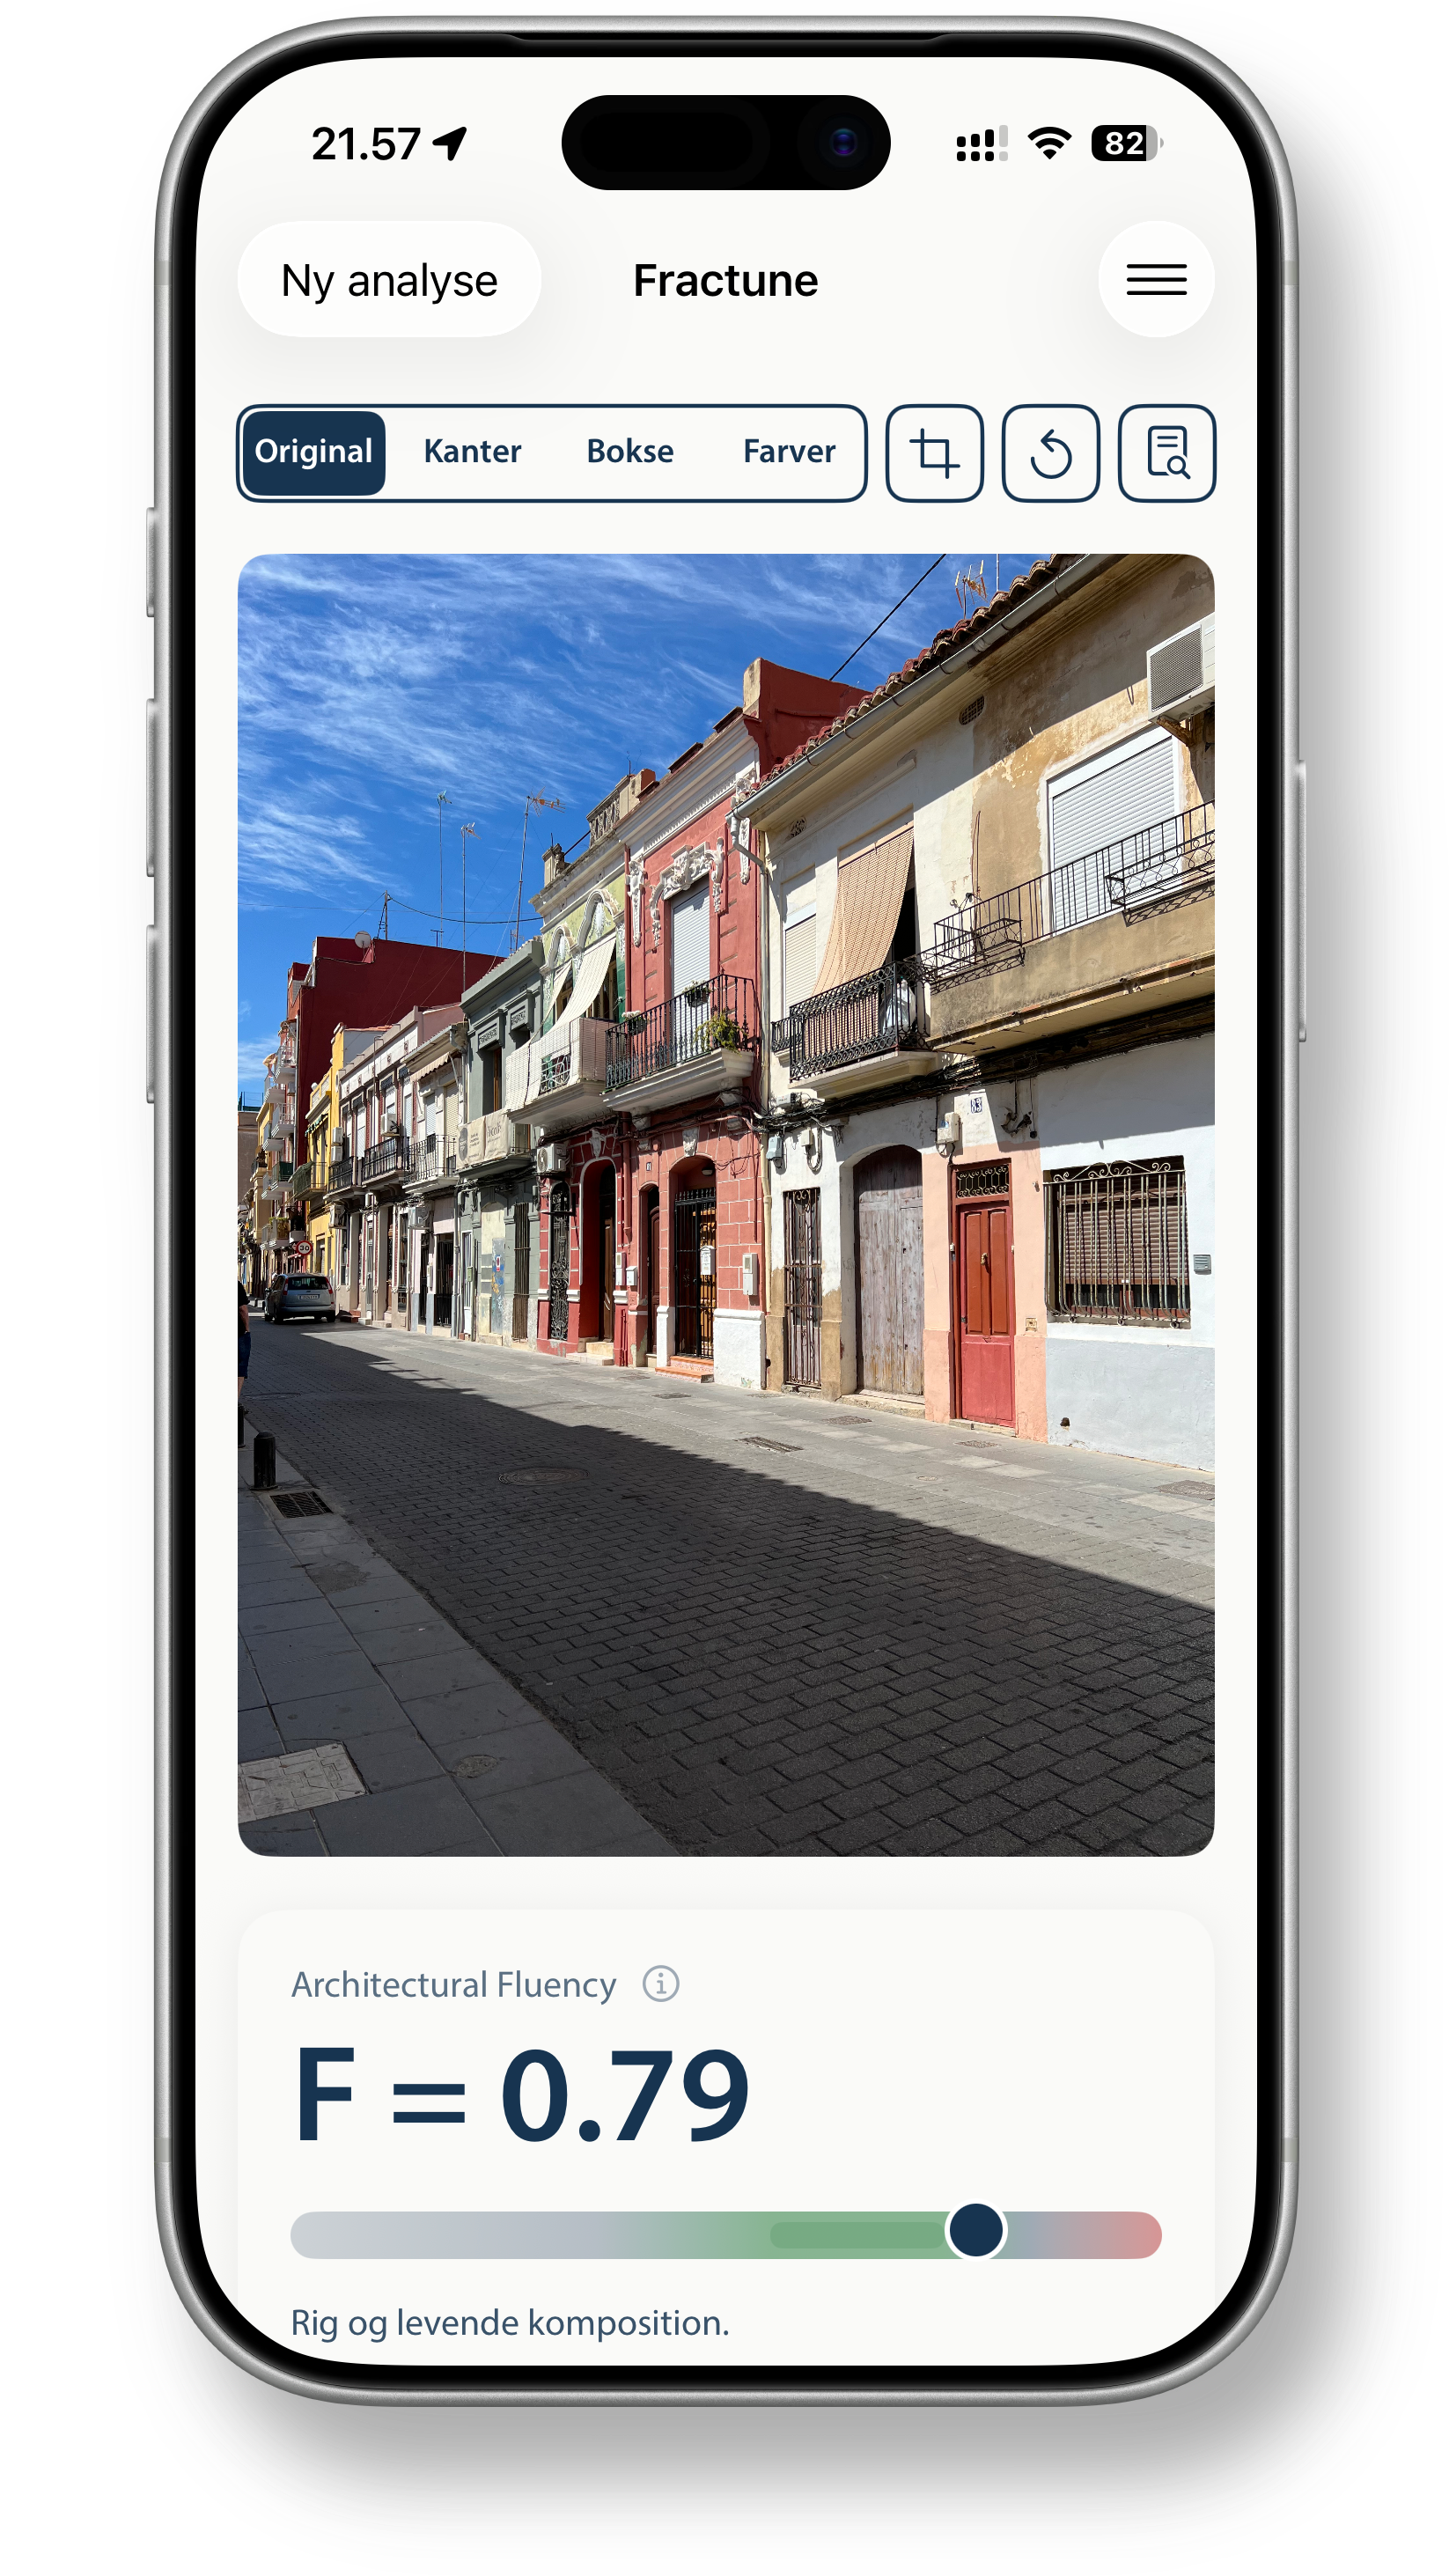
The Fractune app surfaces F three ways:
- Headline number with a sweet-spot bar, at-a-glance indication of where this facade lands. Marker color shifts from grey through green (sweet spot) toward red.
- Confidence indicator, when image quality or perspective skew degrades reliability, F is shown as "F ≈ 0.62 ?" with a hollow marker. The pipeline does not block on poor input; it produces F with an honest uncertainty marker.
- Foldable dimension breakdown, tap to see each of the four dimensions with its own score. Often the breakdown tells you more than the headline: a facade can be strong on rhythm but weak on balance, and that's actionable feedback.
What the sweet spot means.
The 0.55–0.75 zone is calibrated against three converging strands of empirical work. Stamps (2000) regressed facade preference against surface-complexity descriptors and found a coefficient β = 0.72, the strongest single predictor identified. Spehar et al. (2003 and subsequent work) showed visual sensitivity peaks at the 1/f1.2 amplitude spectrum slope of natural scenes. Vartanian et al. (2013) linked curvilinear architectural rooms to stronger anterior cingulate cortex activity in fMRI, an empirical bridge between geometry and affective response.
F brings these strands into one per-facade reading. The 0.55–0.75 range corresponds, roughly, to where well-composed traditional European facades (Renaissance, Baroque, Belle Époque) cluster, where modern Nordic vernacular also tends to land, and where most building styles described as "fluent" or "sammenhængende" by trained architects fall in pilot studies.
F is calibrated, not authoritative. A score of 0.50 does not mean a facade is bad. The number opens a conversation about which dimensions are doing what, that's where the breakdown becomes useful.
Try Fractune.
The headline F, the sweet-spot bar, and the foldable dimension breakdown are all available in the iOS app. Point your camera at any facade and read where it lands.